

KPI Hero: Own Your Leading & Lagging Indicators
Most founders track results. The operators who win track the activities that cause results. Break down OKRs, Balanced Scorecards, and RACI matrices so you own every leading and lagging indicator in your business.

Phase 5 — Long Term Success
The metrics that actually matter and the governance systems that keep a board meeting from becoming theater.
It is a Serial Entrepreneur's Playbook From Idea To Long-Term Success.
Key Performance Indicators
Measure and optimize your performance effectively.
What Most Founders Measure (and Why That's the Problem)
Most founders have dashboards. Most dashboards show revenue, churn, margin, NPS. All real numbers. All useful. All describing things that already happened.
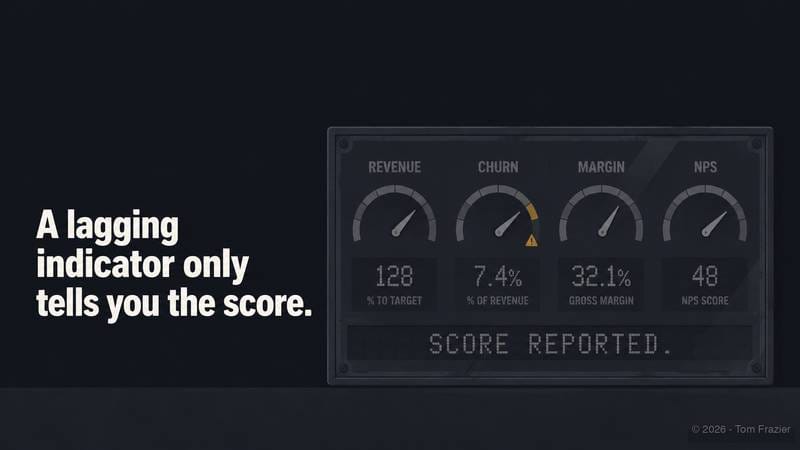
That's the definition of a lagging indicator: a result. A lagging indicator tells you the score. It does not tell you how to play. By the time your monthly revenue report lands, whatever caused that number: the sales calls, the product decisions, the service failures. That all happened weeks ago. You're reading the outcome of a system you can no longer touch.
Leading indicators are different. A leading indicator is an activity: a behavior you can measure today that predicts a result you'll see tomorrow. Sales calls made per rep is a leading indicator for pipeline. Content pieces published is a leading indicator for organic traffic. Employee satisfaction scores are leading indicators for retention. The activity comes first. The result follows.
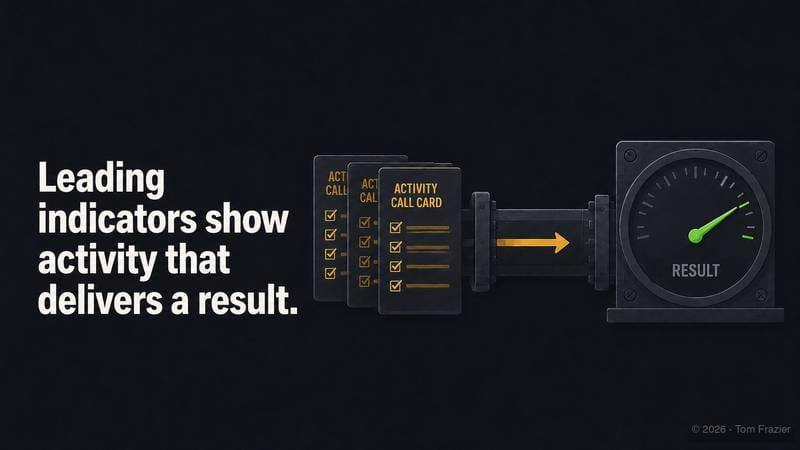
Founders who only track lagging indicators are playing catch-up.
They celebrate or panic based on numbers they can no longer influence. Founders who track leading indicators are running the actual business; they're adjusting inputs before the outputs go sideways.
The framework that ties both together has a name you've likely heard but probably haven't fully operationalized: the Balanced Scorecard. Before we get there, you need the goal-setting system that feeds it. That system is OKRs.
OKRs: The Engine Behind the Scorecard
OKRs stand for Objectives and Key Results.
Andy Grove built the framework at Intel. John Doerr scaled it at Google and documented it in Measure What Matters. The premise is stripped-down:
- an Objective is a qualitative, ambitious statement of what you want to achieve;
- a Key Result is a specific, measurable outcome that tells you whether you got there.
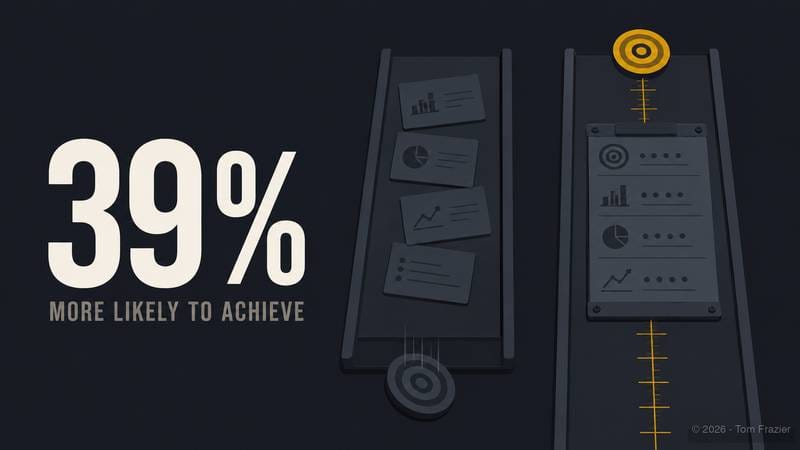
Here's why that matters in numbers. Companies using OKRs are 39% more likely to achieve their goals than those without a formal goal-setting structure. 83% of companies using OKRs report benefiting from the framework. Those aren't soft culture wins. That's the difference between a company that executes and one that intends to.
The distinction that trips most operators up is OKRs versus KPIs. They are not interchangeable. KPIs track the steady-state health of your business. OKRs drive change. A KPI might measure monthly active users; an OKR sets a goal to increase user engagement by 20% in the next quarter. One monitors. The other moves.
Format matters when you're building OKRs. Every Key Result must be SMART:
- Specific
- Measurable
- Achievable
- Relevant, and
- Time-bound.
Vague key results aren't key results. They're wishes.
3 Example Objectives
- Accelerate revenue growth by converting more qualified prospects into paying customers
- Improve product engagement to increase retention and reduce churn
- Build a high-performance team culture that enables sustained execution at scale
| Objective | Key Result | Target | Importance |
|---|---|---|---|
| Accelerate revenue growth | Increase MQL-to-SQL conversion rate from 22% to 35% by end of Q3 | 35% conversion by Sept 30 | SQL volume predicts closed revenue 60 days out |
| Accelerate revenue growth | Close $400K in new ARR from inbound leads by end of Q3 | $400K ARR by Sept 30 | Inbound ARR tests whether positioning works without sales-driven volume |
| Accelerate revenue growth | Reduce average sales cycle from 47 days to 30 days by end of Q3 | 30-day cycle by Sept 30 | Cycle length directly compresses or expands quarterly revenue recognition |
| Improve product engagement | Increase 30-day feature adoption rate from 41% to 65% among new users by Q3 | 65% feature adoption by Sept 30 | Early feature adoption is the strongest predictor of 12-month retention |
| Improve product engagement | Reduce monthly churn from 3.8% to 2.0% by end of Q3 | 2.0% churn by Sept 30 | Each 1% reduction in monthly churn compounds on annual net revenue retention |
| Improve product engagement | Achieve NPS of 45 or above across all customer tiers by Q3 | NPS ≥ 45 by Sept 30 | NPS at this level correlates with referral-driven acquisition, reducing CAC by 20–30% on average |
| Build high-performance team culture | Complete structured onboarding for 100% of new hires within first 30 days by Q3 | 100% 30-day onboarding completion | Structured onboarding cuts time-to-productivity by 34%, protecting early retention |
| Build high-performance team culture | Achieve quarterly employee engagement score of 75 or above by Q3 | Engagement score ≥ 75 by Sept 30 | Engagement scores at this level are leading indicators for retention and discretionary effort |
| Build high-performance team culture | Deliver performance reviews for 100% of team within 2 weeks of quarter close by Q3 | 100% on-time reviews by Oct 14 | Timely performance feedback closes the loop between individual OKRs and company-level results |
Your industry will shift these numbers. The structure stays the same. Organizations that implement consistent OKR cycles outperform inconsistent users by up to 8.5% in productivity.
The Balanced Scorecard: Seeing the Whole Business at Once
A Balanced Scorecard translates your OKRs into a measurement system that covers every dimension of your business. Not just revenue. Developed by Drs. Robert Kaplan and David Norton and first published in the Harvard Business Review in 1992, the BSC framework is now one of the top ten most widely used management tools in the world, running inside more than half of major companies across the US, Europe, and Asia.
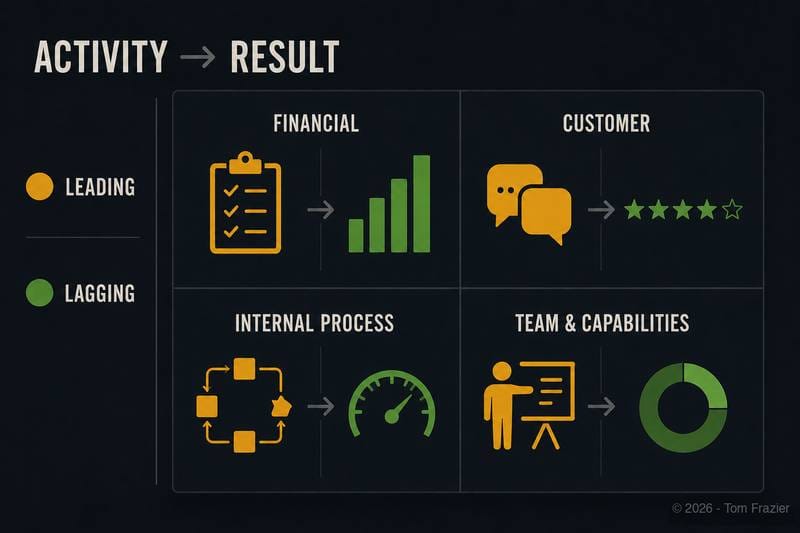
The power is in the pairing: financial outcomes sit alongside the customer behaviors, internal processes, and team capabilities that drive them. Each dimension includes both leading indicators and lagging indicators. Leading = activity that predicts future results. Lagging = result that confirms past performance. That pairing is what separates a Balanced Scorecard from a simple KPI list.
Here's the rule the scorecard enforces: lagging = result; leading = the activity that causes the result. The activity and the result must be correlated. If they aren't, you're tracking noise.
| Indicator | Type | SMART KPI | Reasoning |
|---|---|---|---|
| Monthly Recurring Revenue (MRR) | Lagging (Result) | MRR ≥ $125K by end of Q3 | Revenue confirms whether the business model is working |
| Sales calls completed per rep per week | Leading (Activity) | ≥ 15 qualified calls/rep/week by Q3 | Call volume is the upstream driver of pipeline and closed revenue |
| Gross Margin | Lagging (Result) | Gross margin ≥ 68% by end of Q3 | Margin health confirms pricing and cost discipline |
| Proposal-to-close ratio | Leading (Activity) | Proposal-to-close ≥ 40% by Q3 | Last leading indicator before revenue; forecasts close rate 30 days out |
| Net Promoter Score (NPS) | Lagging (Result) | NPS ≥ 45 by Q3 close | Cumulative result of every customer interaction; clearest signal of relationship health |
| Customer check-in frequency | Leading (Activity) | 100% of accounts touched by CSM monthly by Q3 | Proactive contact cadence is the most reliable predictor of churn prevention |
| Customer Retention Rate | Lagging (Result) | Retention rate ≥ 92% by end of Q3 | Retention is the compounding engine; each retained customer reduces CAC-to-LTV pressure |
| Time-to-first-value | Leading (Activity) | New customers reach first meaningful outcome within 14 days of onboarding | Speed-to-value in first two weeks is the strongest predictor of 90-day retention |
| Bug-to-resolution time | Lagging (Result) | 95% of P1 bugs resolved within 24 hours by Q3 | Resolution time confirms whether internal operations are functioning |
| Code review turnaround | Leading (Activity) | 100% of PRs reviewed within 48 hours by Q3 | Review speed drives deployment cadence and product responsiveness |
| On-time project delivery rate | Lagging (Result) | ≥ 85% of projects delivered on schedule by Q3 | Delivery rate reveals whether planning and execution are aligned |
| Standup completion rate | Leading (Activity) | 95% standup completion across all teams weekly by Q3 | Daily synchronization predicts delivery consistency |
| Employee Net Promoter Score (eNPS) | Lagging (Result) | eNPS ≥ 35 by Q3 | Predicts retention and sustained discretionary effort |
| Training hours per employee per quarter | Leading (Activity) | ≥ 8 hours of structured learning per employee per quarter by Q3 | Skill investment drives capability; teams that train consistently adapt faster |
| Voluntary turnover rate | Lagging (Result) | Voluntary turnover ≤ 10% annualized by Q3 | Confirms culture and compensation are working; most expensive lagging indicator to miss |
| 1:1 cadence completion | Leading (Activity) | 100% of managers conducting weekly 1:1s by Q3 | Manager contact frequency drives engagement, development, and early warning on team health |
The RACI Matrix: Who Owns What
A measurement system without accountability is just a dashboard no one acts on.
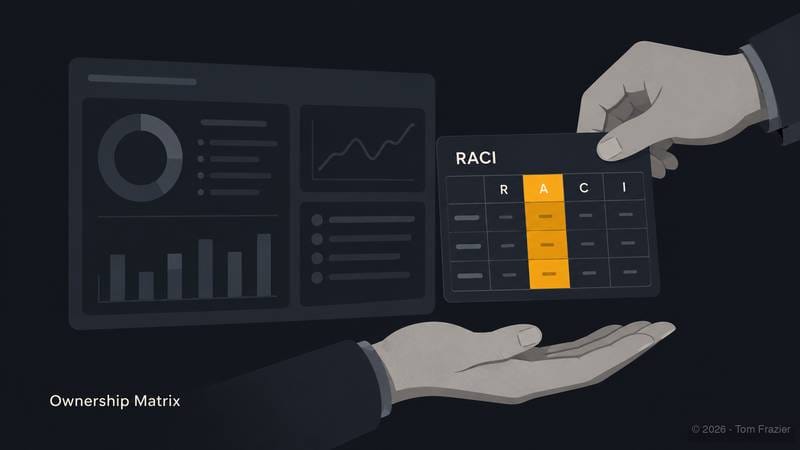
The RACI Matrix puts every critical business process in someone's hands. RACI stands for:
- Responsible (does the work)
- Accountable (owns the outcome)
- Consulted (provides input)
- Informed (kept in the loop).
There are two versions of this exercise. Most operators only do one.
- The ideal RACI shows you the team structure that would run this measurement system at full effectiveness.
- The lean RACI shows you what you can actually execute right now.
The point of doing both isn't to feel bad about the gap. It's to make the gap visible so you know exactly what to build toward. Below are some template RACI matrices to copy.
(Sample) Ideal RACI Matrix
Job Titles for a Fully-Resourced Measurement System: Chief Operating Officer (COO), Chief Financial Officer (CFO), VP of Sales, VP of Customer Success, VP of Marketing, VP of Engineering / CTO, Head of People / HR Director, Data Analyst / Business Intelligence Manager, Department Managers, OKR Program Manager / Strategy Operations Lead.
| Business Process | COO | CFO | VP Sales | VP CS | VP Mktg | CTO | Head of People | Data Analyst | Dept Mgrs | OKR PM |
|---|---|---|---|---|---|---|---|---|---|---|
| OKR Setting (Company Level) | A | C | C | C | C | C | C | I | I | R |
| OKR Setting (Team Level) | I | I | A | A | A | A | A | I | R | C |
| KPI Reporting (Weekly) | I | C | R | R | R | R | R | A | C | C |
| Balanced Scorecard Review (Monthly) | A | R | C | C | C | C | C | R | I | C |
| Financial Performance Analysis | C | A | R | I | I | I | I | R | I | I |
| Customer Health Monitoring | I | I | C | A | I | I | I | R | R | I |
| Product & Process Improvement | A | I | C | C | I | R | I | C | R | I |
| Employee Engagement Measurement | A | I | I | I | I | I | R | C | C | I |
| OKR Quarterly Review | A | C | C | C | C | C | C | C | C | R |
| Board-Level Reporting | R | R | I | I | I | I | I | C | I | C |
(Sample) Lean RACI Matrix - Minimum Viable Team
Most early-stage operators don't have ten functional leaders. They have a founder, a co-founder if they're lucky, one or two senior managers, and a team of individual contributors. The system still works. It just means certain people carry multiple roles.
Minimum Roles: Founder/CEO, Head of Sales or Sales Lead, Head of Customer Success or Operations Lead, Head of Engineering or Lead Developer, People Lead or Office Manager, Generalist Analyst (part-time or fractional).
| Business Process | Founder/CEO | Sales Lead | Ops/CS Lead | Eng Lead | People Lead | Analyst |
|---|---|---|---|---|---|---|
| OKR Setting (Company Level) | A/R | C | C | C | C | I |
| OKR Setting (Team Level) | C | A/R | A/R | A/R | A/R | I |
| KPI Reporting (Weekly) | A | R | R | R | C | R |
| Balanced Scorecard Review (Monthly) | A/R | C | C | C | C | R |
| Financial Performance Analysis | A/R | C | I | I | I | R |
| Customer Health Monitoring | A | I | R | C | I | C |
| Product & Process Improvement | A | I | C | R | I | C |
| Employee Engagement Measurement | A | I | C | I | R | C |
| OKR Quarterly Review | A/R | C | C | C | C | C |
| Board-Level Reporting | A/R | I | I | I | I | C |
With this structure, cut your active KPI list to 8-10 total across all four scorecard perspectives. Focus on the two highest-signal metrics per perspective: one leading, one lagging. Review them weekly.
What to Do This Week
Pick one thing. Not three. One.
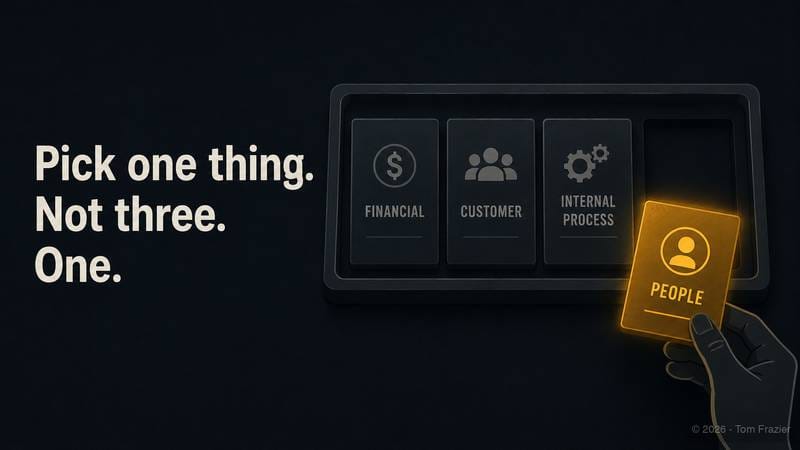
Choose the perspective of your Balanced Scorecard where you have the least visibility right now: financial, customer, internal process, or people. Find the single leading indicator in that perspective you're not currently tracking. Set a target. Assign an owner. Review it weekly for four weeks.
At the end of four weeks, you'll know two things:
- whether that activity metric actually predicts the outcome you care about, and
- whether you've built the review discipline to sustain a full measurement system. Both answers are worth knowing.
The measurement system doesn't get built in a sprint. It gets built in layers. Start with the metric that tells you the most about the thing you understand the least — because once you can see the leading signal, you can start managing the result instead of reacting to it.
This is the first article in Phase 5 — Long Term Success. You can access the AI tool below.
Use the KPI Hero GPT to define and manage your IP portfolio. A free AI tool just for subscribers. ⤵️
This article is why I built the KPI Hero GPT. It will help you develop tailored business metrics, such as OKRs, Balanced Scorecards and a Business Process RACI Matrix.
Optimize Your Performance & Strategy Execution.
Common Questions About KPI Hero
Aren't KPIs too rigid for a dynamic business environment?
KPI Hero can adapt KPIs to be flexible, ensuring they remain relevant and align with the evolving business landscape.
How can I ensure the OKRs developed are practical for my business?
KPI Hero tailors OKRs to fit the specific needs and capabilities of your business, ensuring practicality and achievability.
Is a Balanced Scorecard really necessary for small businesses?
KPI Hero designs Balanced Scorecards to suit businesses of all sizes, providing valuable insights for growth and improvement at any scale.
Can I integrate existing business strategies with new KPI frameworks?
KPI Hero excels in integrating new KPI frameworks with your existing business strategies, enhancing coherence and effectiveness.
Are these KPI tools too complex for my team to understand?
KPI Hero ensures that the KPI tools and frameworks provided are user-friendly and easily comprehensible for all team members.
This post is for subscribers only
Sign up now to get access to the post.
Already a member? Sign in


