
You Don't Need a Data Science Team to Price Your Product
Most founders price by gut feel and consensus. There's a faster, more rigorous alternative — and it now takes under an hour with AI.
There's a pricing conversation that happens in almost every early-stage company, and it goes roughly like this: someone throws out a number, someone else says it feels too high, a third person says it feels too low, and eventually you go-to-market with whatever feels least wrong in the room.
That's not pricing. That's a coin flip with extra steps.
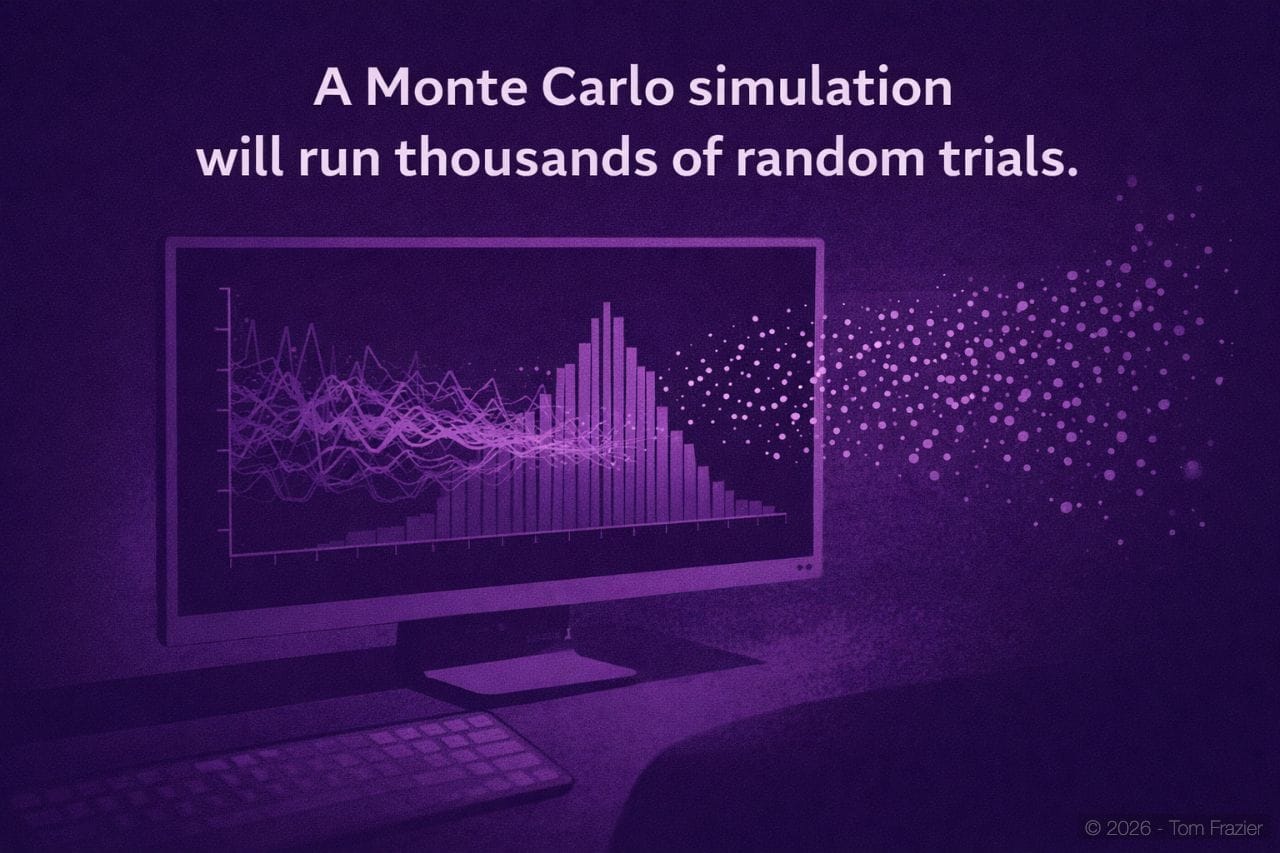
The traditional antidote is a Monte Carlo simulation — a statistical method where you run thousands of randomized trials across a set of variables to understand the probability distribution of outcomes. It's powerful. It's also the kind of thing that used to require a data science team, a few days of work, and a budget line item to justify it.
Not anymore.
I recently priced a new product — a voice AI service that interviews you for two hours to build a persistent memory of your life and work — using nothing but a conversational AI session and a couple of interactive HTML tools built on the fly. The entire process took under an hour. The output was as rigorous as anything a consultant would hand you.
Here's exactly how I did it, and why this approach should be your first move before you touch pricing ever again.
The Problem With Gut Pricing
The mistake most operators make is treating price as a single variable. They pick a number and ask: will people pay this?
That's the wrong question.
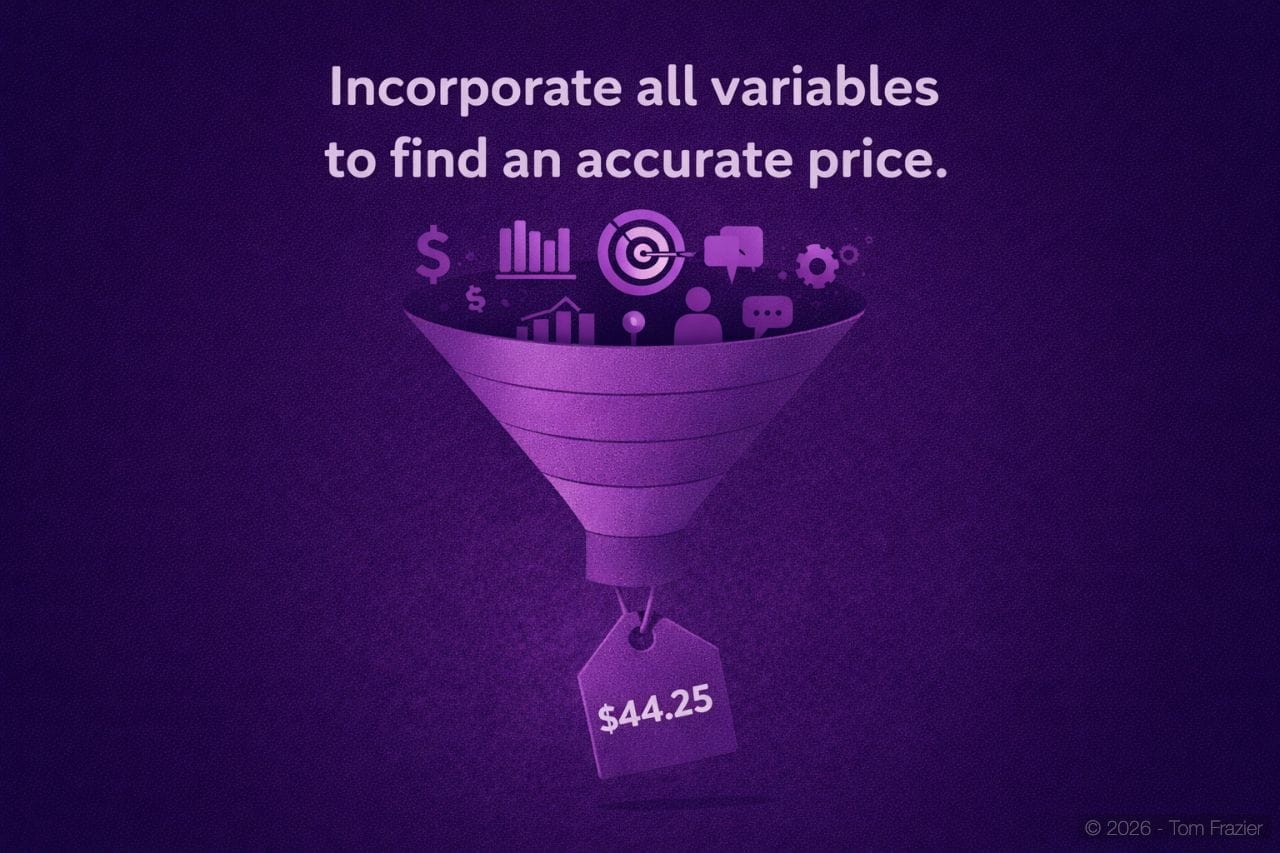
The right question is: across the realistic range of outcomes, which price point produces the best expected result — accounting for conversion, margin, transaction costs, and customer lifetime value simultaneously?
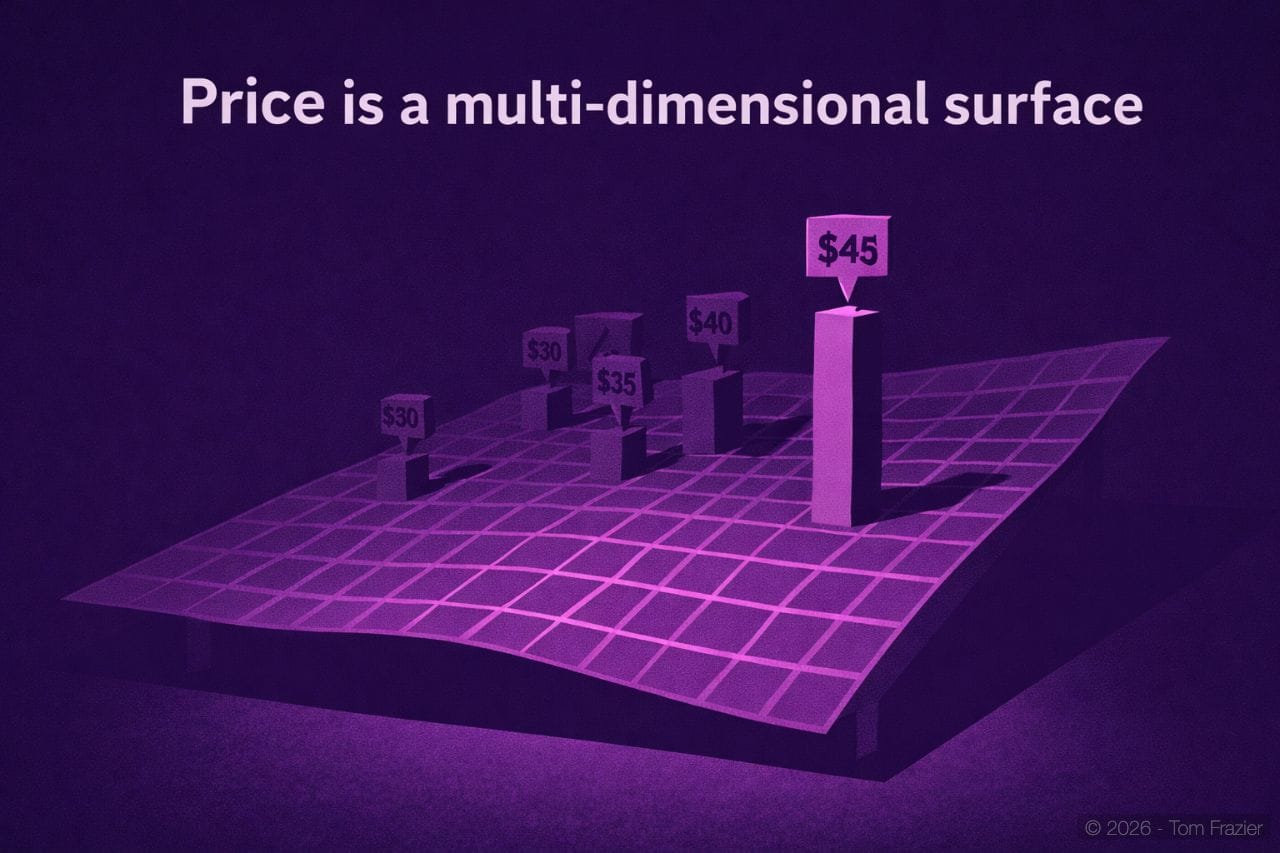
When you frame it that way, you immediately see why gut pricing fails. You're not choosing a number. You're choosing a position on a multi-dimensional surface, and the shape of that surface only becomes visible when you run the scenarios.
What Monte Carlo Actually Does
A Monte Carlo simulation doesn't predict the future. It maps uncertainty.
You define the variables you're not sure about — in my case, conversion rate — and give them a realistic range. The simulation then runs thousands of random trials, sampling from that range each time, and records the outcome for every price point in every trial.
What you end up with isn't a single answer. It's a distribution: here's what happens in the pessimistic 10% of scenarios, here's the median, here's the optimistic 90%. And critically, here's which price point wins most often across all of them.
That last metric — win rate — is the one most pricing analyses miss entirely. A price that produces the highest median LTV but loses 70% of trials to a cheaper alternative is not actually your best price. Win rate tells you which price is most robust to uncertainty.
The AI-Accelerated Version
Here's the process I ran, which you can replicate in a single session.
Step 1: Define your variables and ranges.
I knew a few things for certain: Polar.sh charges 4% + $0.40 per transaction. My onboarding fee was $99. My monthly subscription would land somewhere between $8.99 and $15.99. Average retention I estimated at 12 months.
What I didn't know was conversion rate. My honest range was 1.5% to 4% — that's where my uncertainty lived.
Step 2: Build the deterministic model first.
Before running simulations, I asked Claude to build an interactive pricing tool that calculated net revenue, LTV per subscriber, and total LTV pool across every price point — assuming fixed conversion rates. This is your baseline. It tells you the shape of the economics before you introduce randomness.
At this stage I could already see that the $0.40 fixed transaction fee punishes low price points disproportionately. At $8.99, that flat fee alone represents 4.5% of gross revenue before the percentage fee even kicks in. That asymmetry matters.
Step 3: Run the Monte Carlo layer.
With the deterministic model validated, I then asked for a Monte Carlo version: 10,000 trials, conversion rate sampled uniformly from 1.5%–4%, price range swept from $8.99 to $15.99 in $0.50 increments.
Each trial independently samples a conversion rate for the low-price end and the high-price end — both constrained within your stated range — then interpolates linearly across every price point between them. The curve shape varies across trials; both endpoints always stay within bounds. It calculates total LTV pool for every price point, records which price wins, and repeats 10,000 times.
The output: win rate per price point, plus P10/P50/P90 percentile bands showing the full distribution of outcomes.
Step 4: Read the surface, not just the peak.
Here's what the simulation told me that gut pricing never would have:
The optimal price under this conversion range was not at the extremes. The low end ($8.99–$9.99) gets punished by the fixed transaction fee and needs significantly higher volume to compensate — volume that the conversion range doesn't reliably deliver. The high end ($14.99–$15.99) produces better margins per unit but the win rate collapses because even modest downside conversion scenarios make it lose to mid-range prices.
The sweet spot was in the $11.50–$13.00 range.
Not because it's highest in any single scenario, but because it wins most consistently across the full uncertainty range.
That's a different insight than "what's the maximum I can charge."
Why This Changes the Calculus for Early-Stage Products
The traditional argument for skipping rigorous pricing analysis early was cost. Hiring someone to do this properly was a project. Now it's a conversation.
More importantly, this approach forces you to make your assumptions explicit. You can't run a simulation without naming your uncertainty — and naming uncertainty is itself the valuable act. Most founders don't actually know what they think their conversion range is. The process of specifying it, even roughly, produces better decisions than any amount of intuition.
The output is also something you can update. Change your Polar fee structure. Change your retention assumption. Change your lead pool size. The simulation reruns in seconds. You now have a living model instead of a one-time guess.
The Moment the Simulation Lied to Me (and How I Caught It)
Here's something I didn't plan to write about, but it's too instructive to leave out.
The first version of the Monte Carlo came back with a winner: $8.99. The lowest price in the range, by a wide margin. That didn't feel right. The deterministic model had already shown me that the $0.40 flat fee makes cheap prices structurally inefficient. The idea that the simulation would then crown the cheapest price as optimal was a contradiction I couldn't ignore.
So I asked why.
The bug was in the conversion scaling logic. The model was sampling a random base conversion rate, then multiplying it down by a fixed ratio for higher prices. When the base was drawn at the low end of the range — say 1.6% — and then scaled further for high-price scenarios, the effective conversion rate for $15.99 could fall to 0.6%. Well below the stated floor of 1.5%. The simulation was punishing high prices with conversion rates I'd explicitly said were out of bounds. It produced a confidently wrong answer.
The fix was to sample two independent points — conversion at the low price end and conversion at the high price end — both constrained within the stated range, with the curve interpolating between them. That's the correctly specified model. And when I ran it, the result shifted into the $11.50–$13.00 range, which is exactly where the economics should have pointed.
I'm including this because it illustrates something important about using AI for quantitative work: the tool will build what you describe, not necessarily what you mean.
The model was internally consistent. It just modelled the wrong thing. The only reason I caught it was that I had enough intuition about the underlying economics to notice when the output contradicted first principles.
That's the human-in-the-loop check this whole approach depends on. You don't need to be able to build the simulation yourself. You do need to be able to sanity-check the answer.
The Limitations You Should Know
This approach has real constraints. A Monte Carlo simulation is only as good as the ranges you feed it. If your conversion assumption is wildly wrong — if you assume 1.5%–4% and reality is 0.3% — the simulation gives you confidently wrong answers.
It also assumes linear relationships that may not hold. Real conversion rates don't scale uniformly with price in all markets. There are price points where the psychology shifts discontinuously — where $12.99 feels fundamentally different from $13.00 in ways a linear model won't capture.
Use this as a first-pass filter, not a final answer.
It's designed to eliminate obviously wrong price points and give you a defensible starting position. From there, you test with real customers.
But here's the honest comparison: before this approach, the alternative for most early-stage operators was a gut feel anchored to whatever a competitor charges. A simulation with imperfect inputs beats that handily.
How to Do This Yourself
You don't need a developer. You don't need a data scientist. You need a clear head and 30-45 minutes.
- Write down your known fixed costs per transaction (payment processor fees, infrastructure costs per user, etc.)
- Estimate your realistic price range — not your aspirational range, your honest range
- Estimate your conversion uncertainty as a range, not a point — "I think it's somewhere between X and Y"
- Ask an AI to build you a deterministic pricing model first. Validate that the math looks right.
- Ask it to add a Monte Carlo layer with N trials — make sure conversion endpoints are sampled independently and constrained within your stated range, not scaled from a single draw
- Look at win rate, not just median LTV. The most robust price wins most trials.
- Sanity-check the output against first principles before you trust it. If the simulation tells you the cheapest price wins and your fixed transaction costs say that shouldn't be possible, the model is wrong. Ask why.
- Check your P10 column (10th percentile of your measurement) — that's your downside scenario. Make sure you can survive it.
The whole exercise costs you nothing but time. It produces a position you can defend to investors, a co-founder, or yourself — because it's grounded in explicit assumptions, not instinct.
Pricing is not a guess you make once. It's a model you maintain. The faster you can iterate on it, the better your chances of landing somewhere that actually works.
The tools now exist to do this in an afternoon. There's no excuses, so get started today.